4. DIMS architectural design
Figure DIMS Integrated System Architecture illustrates the combined systems of the PRISEM project, the Trident portal (formerly the Ops-Trust portal), and the DIMS back end. As much as possible, the DIMS architecture was built to be overlaid on top of, or merged into, similar components from these existing systems. For example, it is not necessary to run three DNS servers for each project, when one can handle multiple systems and possibly even multiple domains. These can thus be collapsed into one server for DNS. The same is true for LDAP and OpenID authentication (the Trident portal and DIMS are both designed to use these services) and there is only need for one AMQP message bus server, one mail server, and one database for security data. All access will be centralized through the OpenVPN server, with certificates and encryption keys provided to the user via the Trident portal.
Note
This document was originally written prior to the Ops-Trust portal being renamed Trident. The name Ops-Trust portal may still exist throughout this, and related DIMS documents. An effort has been made to cross-reference the new portal name where possible.

DIMS Integrated System Architecture
4.1. System Software Architecture
The DIMS system conforms with the hardware/software separation used by the Trident and PRISEM systems, which pre-date the DIMS project. In both of these projects, some separation of services across physical and/or virtual machines was done for various reasons of security, performance, scalability, ease of administration, conformance with operating system version dependencies, etc.
4.1.1. SIEM event correlation server
The PRISEM system uses a Log Matrix “Threat Center” system, hosted on a high-end Dell server with multiple cores, large RAM capacity, an SSD drive to accelerate database activities, and 2TB RAID 1 array for disk fault tolerance. This system runs CentOS 6.4.
4.1.2. SIEM log archive server
The PRISEM system uses a Log Matrix “Log Center” system, hosted on a high-end Dell server with multiple cores, and 9TB RAID 5 array disk fault tolerance. This system runs CentOS 5.10 (due to compatibility issues with the Vertica database).
4.1.3. Virtual machine management server
The PRISEM system uses a Dell PowerEdge R715 for virtual machine hosting.
4.1.4. AMQP broker
The PRISEM system uses a virtual machine running RabbitMQ for AMQP broker services.
4.1.5. Collective Intelligence Framework (CIF) server
The PRISEM system is using a CIF v0.1 database on physical hardware (Dell PowerEdge 1950). This system will be replaced with a virtual machine running CIF v1.0 (or newer).
4.1.6. ID management and authentication server
The Ops-Trust and DIMS projects are using OpenID and LemonLDAP (though in slightly different ways). The intention is to combine these into a single pair of OpenID/LDAP servers.
4.1.7. Domain name server
The Ops-Trust system runs its own DNS server for all system components in a single-purpose VM. The PRISEM project is currently using static host tables and DNSMasq in slightly different ways (depending on whether access is from the open internet, or through the OpenVPN tunnel). It is anticipated that a split-DNS configuration, using the same server as the Ops-Trust infrastructure, will be used in the long run to get consistent DNS response regardless of access method used.
4.1.8. Virtual private network tunnel server(s)
The PRISEM project has an OpenVPN server for remote access to the backdoor VLAN. This allows access to the AMQP broker, and direct access to the MySQL databases used by Log Matrix. (The vendor maintains their own Cisco managed VPN/firewall for access from their internal network).
DIMS components are separated (as appropriate) for similar reasons, and integrated as much as possible by combining similar services in order to minimize the total number of physical and/or virtual machines in use. For example, if there are three domain name servers, they can be combined into one server that handles multiple domains.
The following Figures help illustrate the concepts of system implementation of the service components in relationship to physical (“bare-metal”) hardware.
Of course the simplest design is to take a hardware system, install a single operating system on it, and install every piece of software into that single server. For the reasons listed above, this is not a viable or practical solution, since the component pieces were never designed to work this way. The level of effort required to debug, patch, document, and attempt to get the original authors to accept the code changes into their code base (to avoid adding a maintence cost for maintaining your locally patched fork as new versions of the original software are released) is not sustainable.
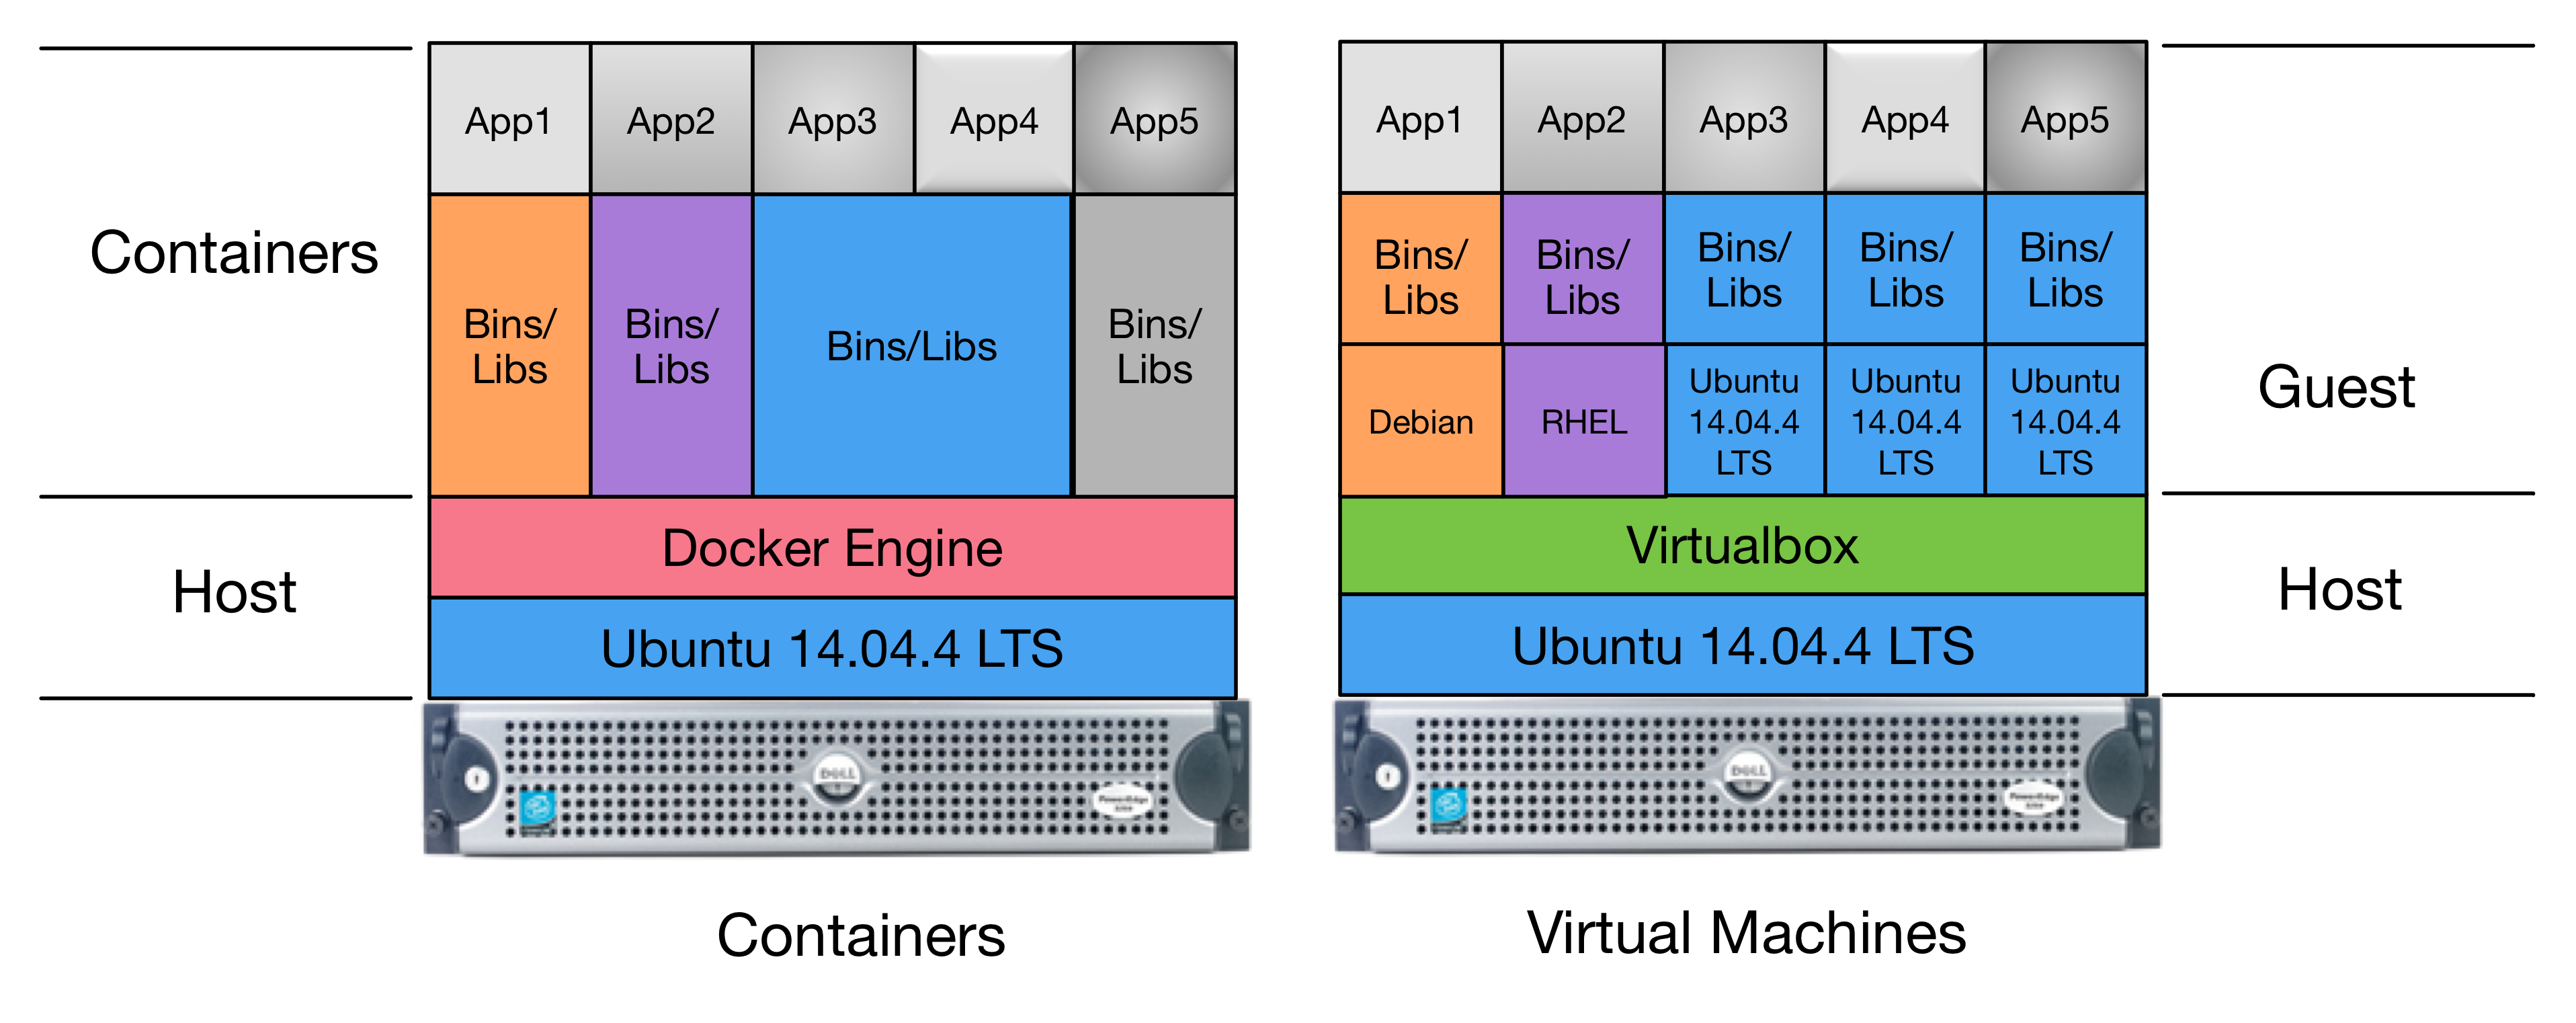
Figure Pure Virtual Machine Architecture shows the next simplest design, which is to host multiple virtual machines on a single server. The Host is shown at the bottom, comprised of a highly-provisioned server, a base operating system and a virtual machine hypervisor. Each virtual machine Guest is then created and installed with its own combination of base operating system, libraries and binaries, and application software. The result is a single physical computer with a total of six servers (4 Ubuntu Linux, 1 Red Hat Enterprise Linux, and 1 Debian Linux) that must be configured, patched, and maintained separately. There is also a higher overhead for processing and memory, due to the hypervisor hardware virtualization layer.
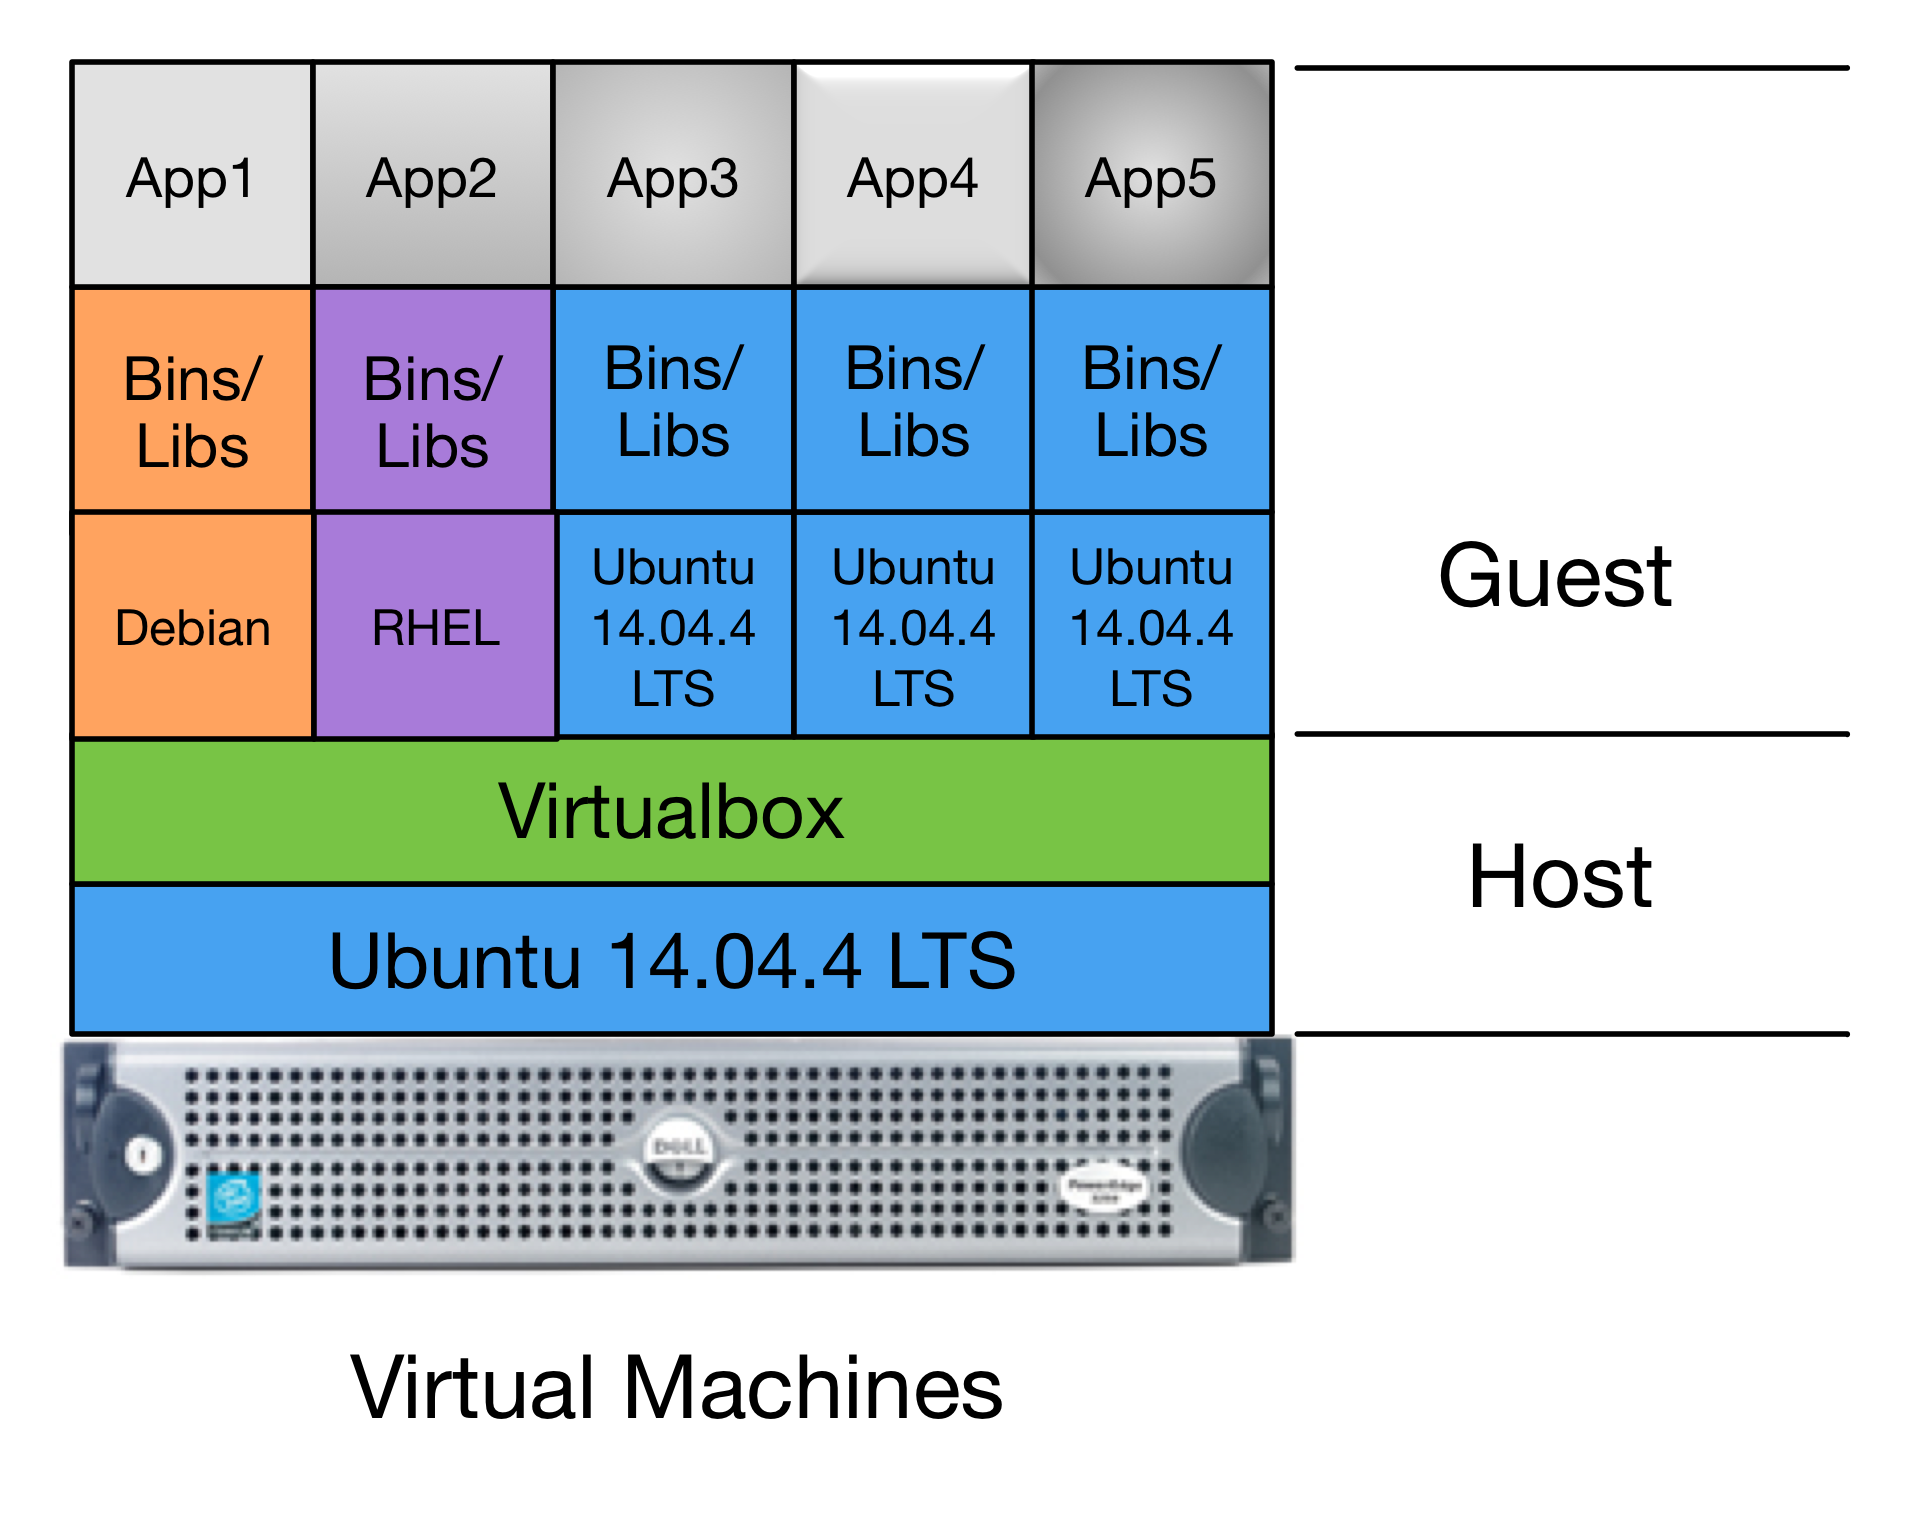
Pure Virtual Machine Architecture
Figure Pure Container Architecture shows an alternative to virtual machines, which is the use of pure containerization of all services. In this architectural model, the Docker Engine replaces the hypervisor as part of the Host layer. On top of this are Containers formed from images that combine the foundational operating system bits, libraries, binaries, and application software as in Figure Pure Virtual Machine Architecture, except there is no virtualization of hardware taking place. Instead, container images hold the file system contents that are then executed in isolated process spaces that function similarly to virtual machines (though simpler, as they only provide a service oriented function, rather than a fully-functional operating system into which you log in to like a “normal” virtual machine or bare-metal operating system.) One of the principle advantages to this architectural model is the separation of content in each container, allowing just the specific base operating system, binaries and libraries, and application code for each open source security tool to be set up exactly as the producer supports with no risk of that breaking other tools that are part of the larger system.
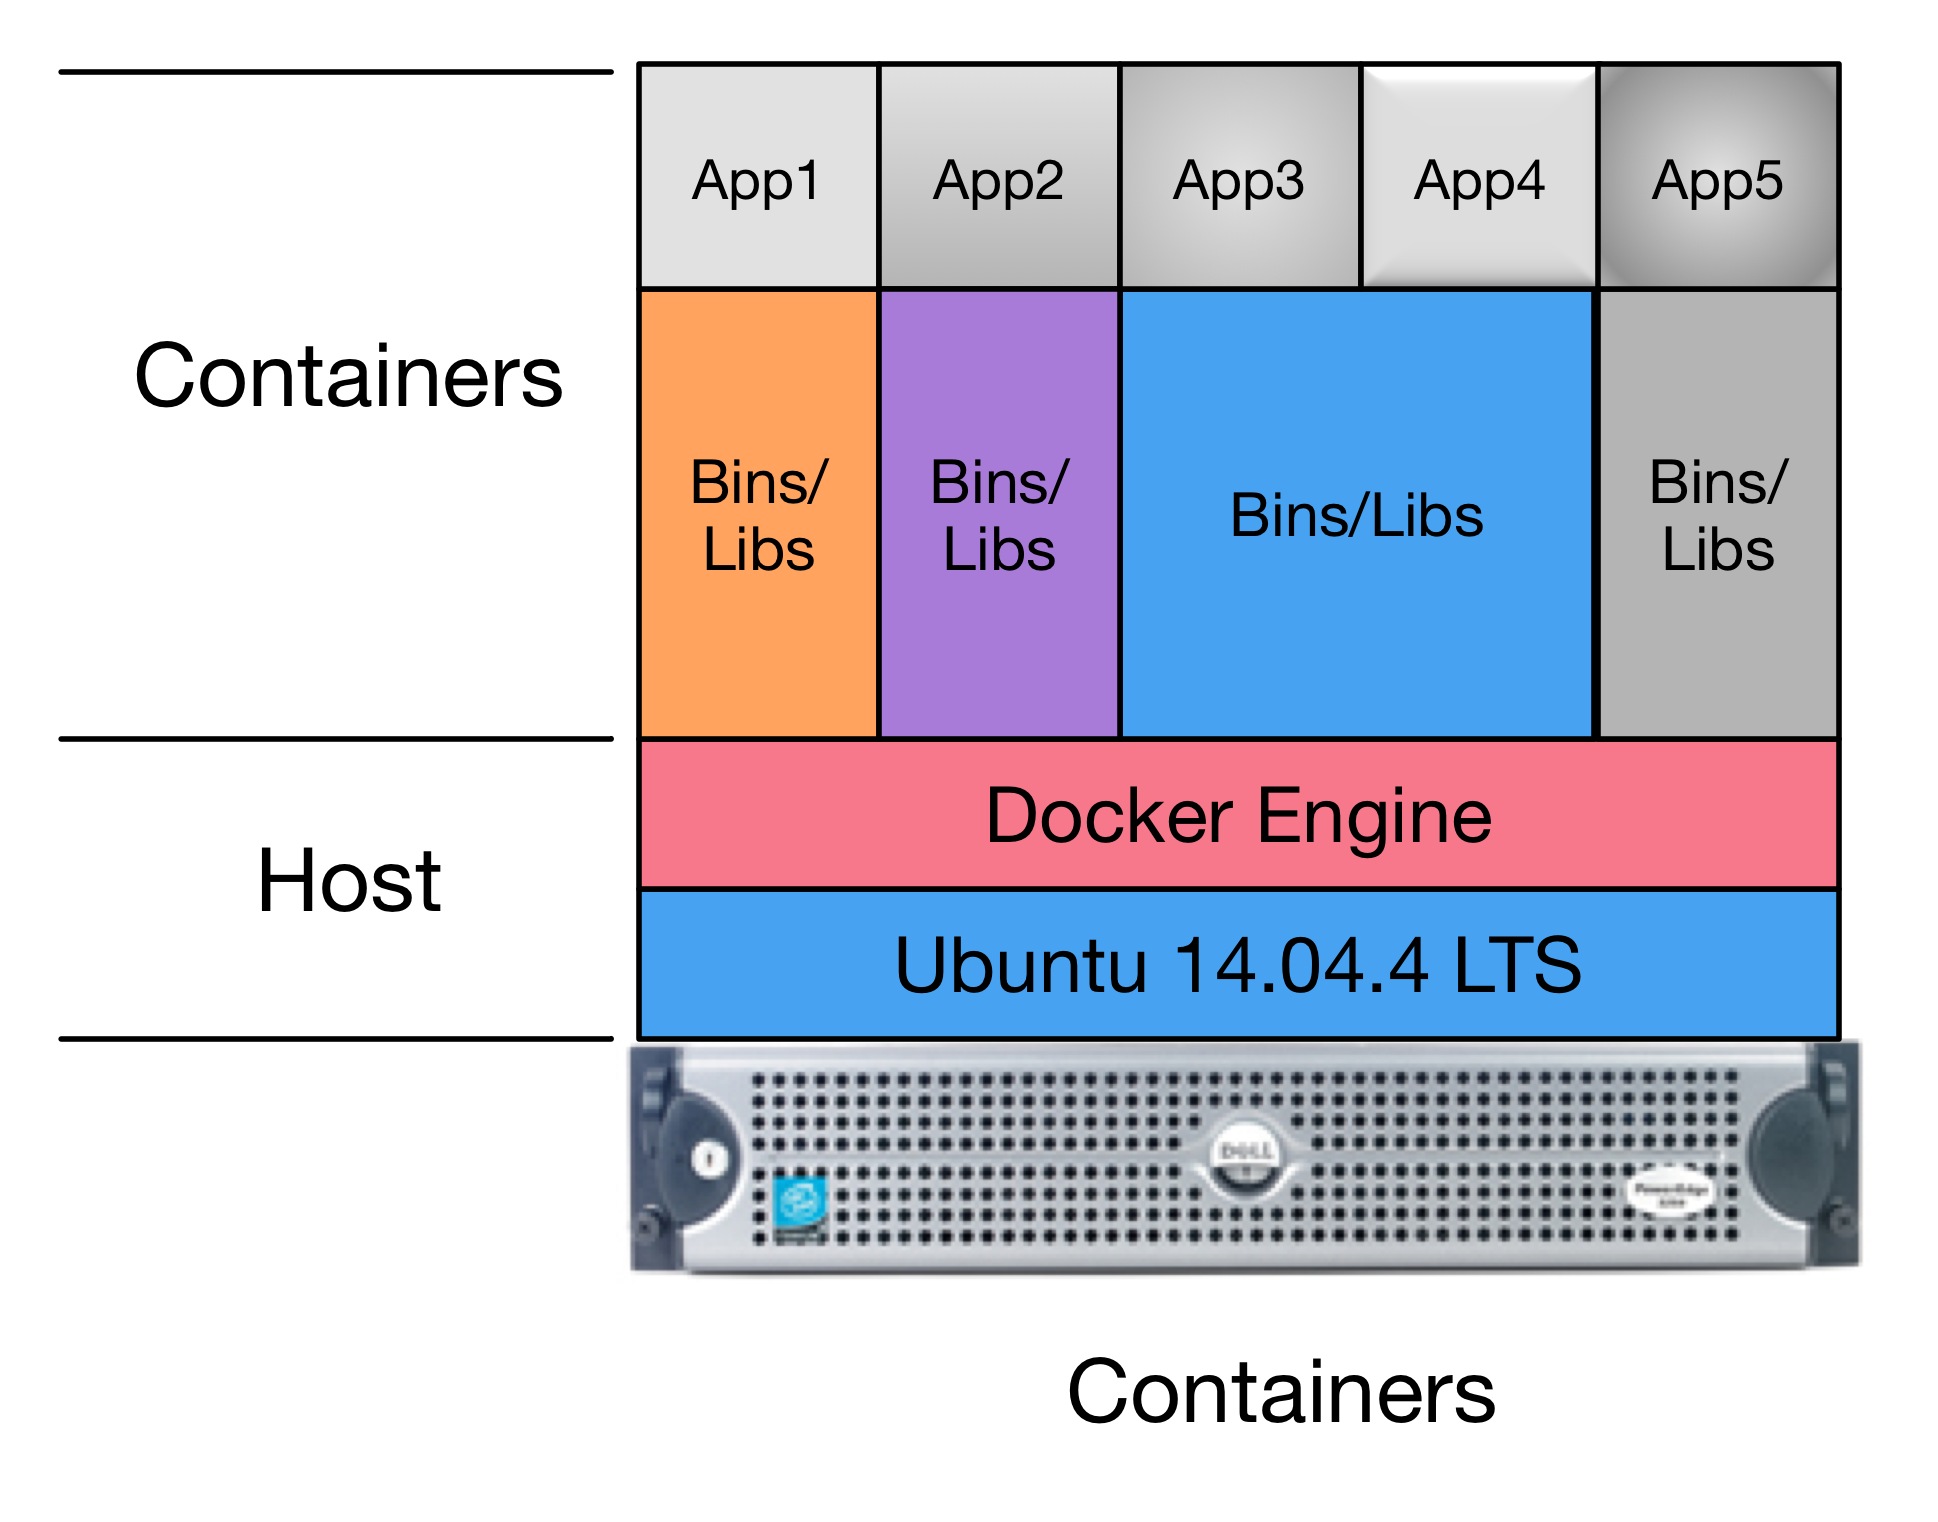
Pure Container Architecture
Of course is it much more complicated than this in real life. Requirements for scalability and redundancy drive towards use of multiple bare-metal servers. This leads to two more architectural models to add to the mix.
The first is to clusterize the containerized model we just saw.
Figure Clusterized Container Architecture depicts a two-node
CoreOS cluster. A program etcd is used as a distributed key/value
store that facilitates managing the distribution and management of
containers across the two server nodes. App2 and App3, in this
case, have multiple instances running (2x App2 and 3x App3, in
this case), both split across the two cluster members. This allows
one of the two cluster servers to be taken off-line without
disrupting the services provided by App2 and App3.
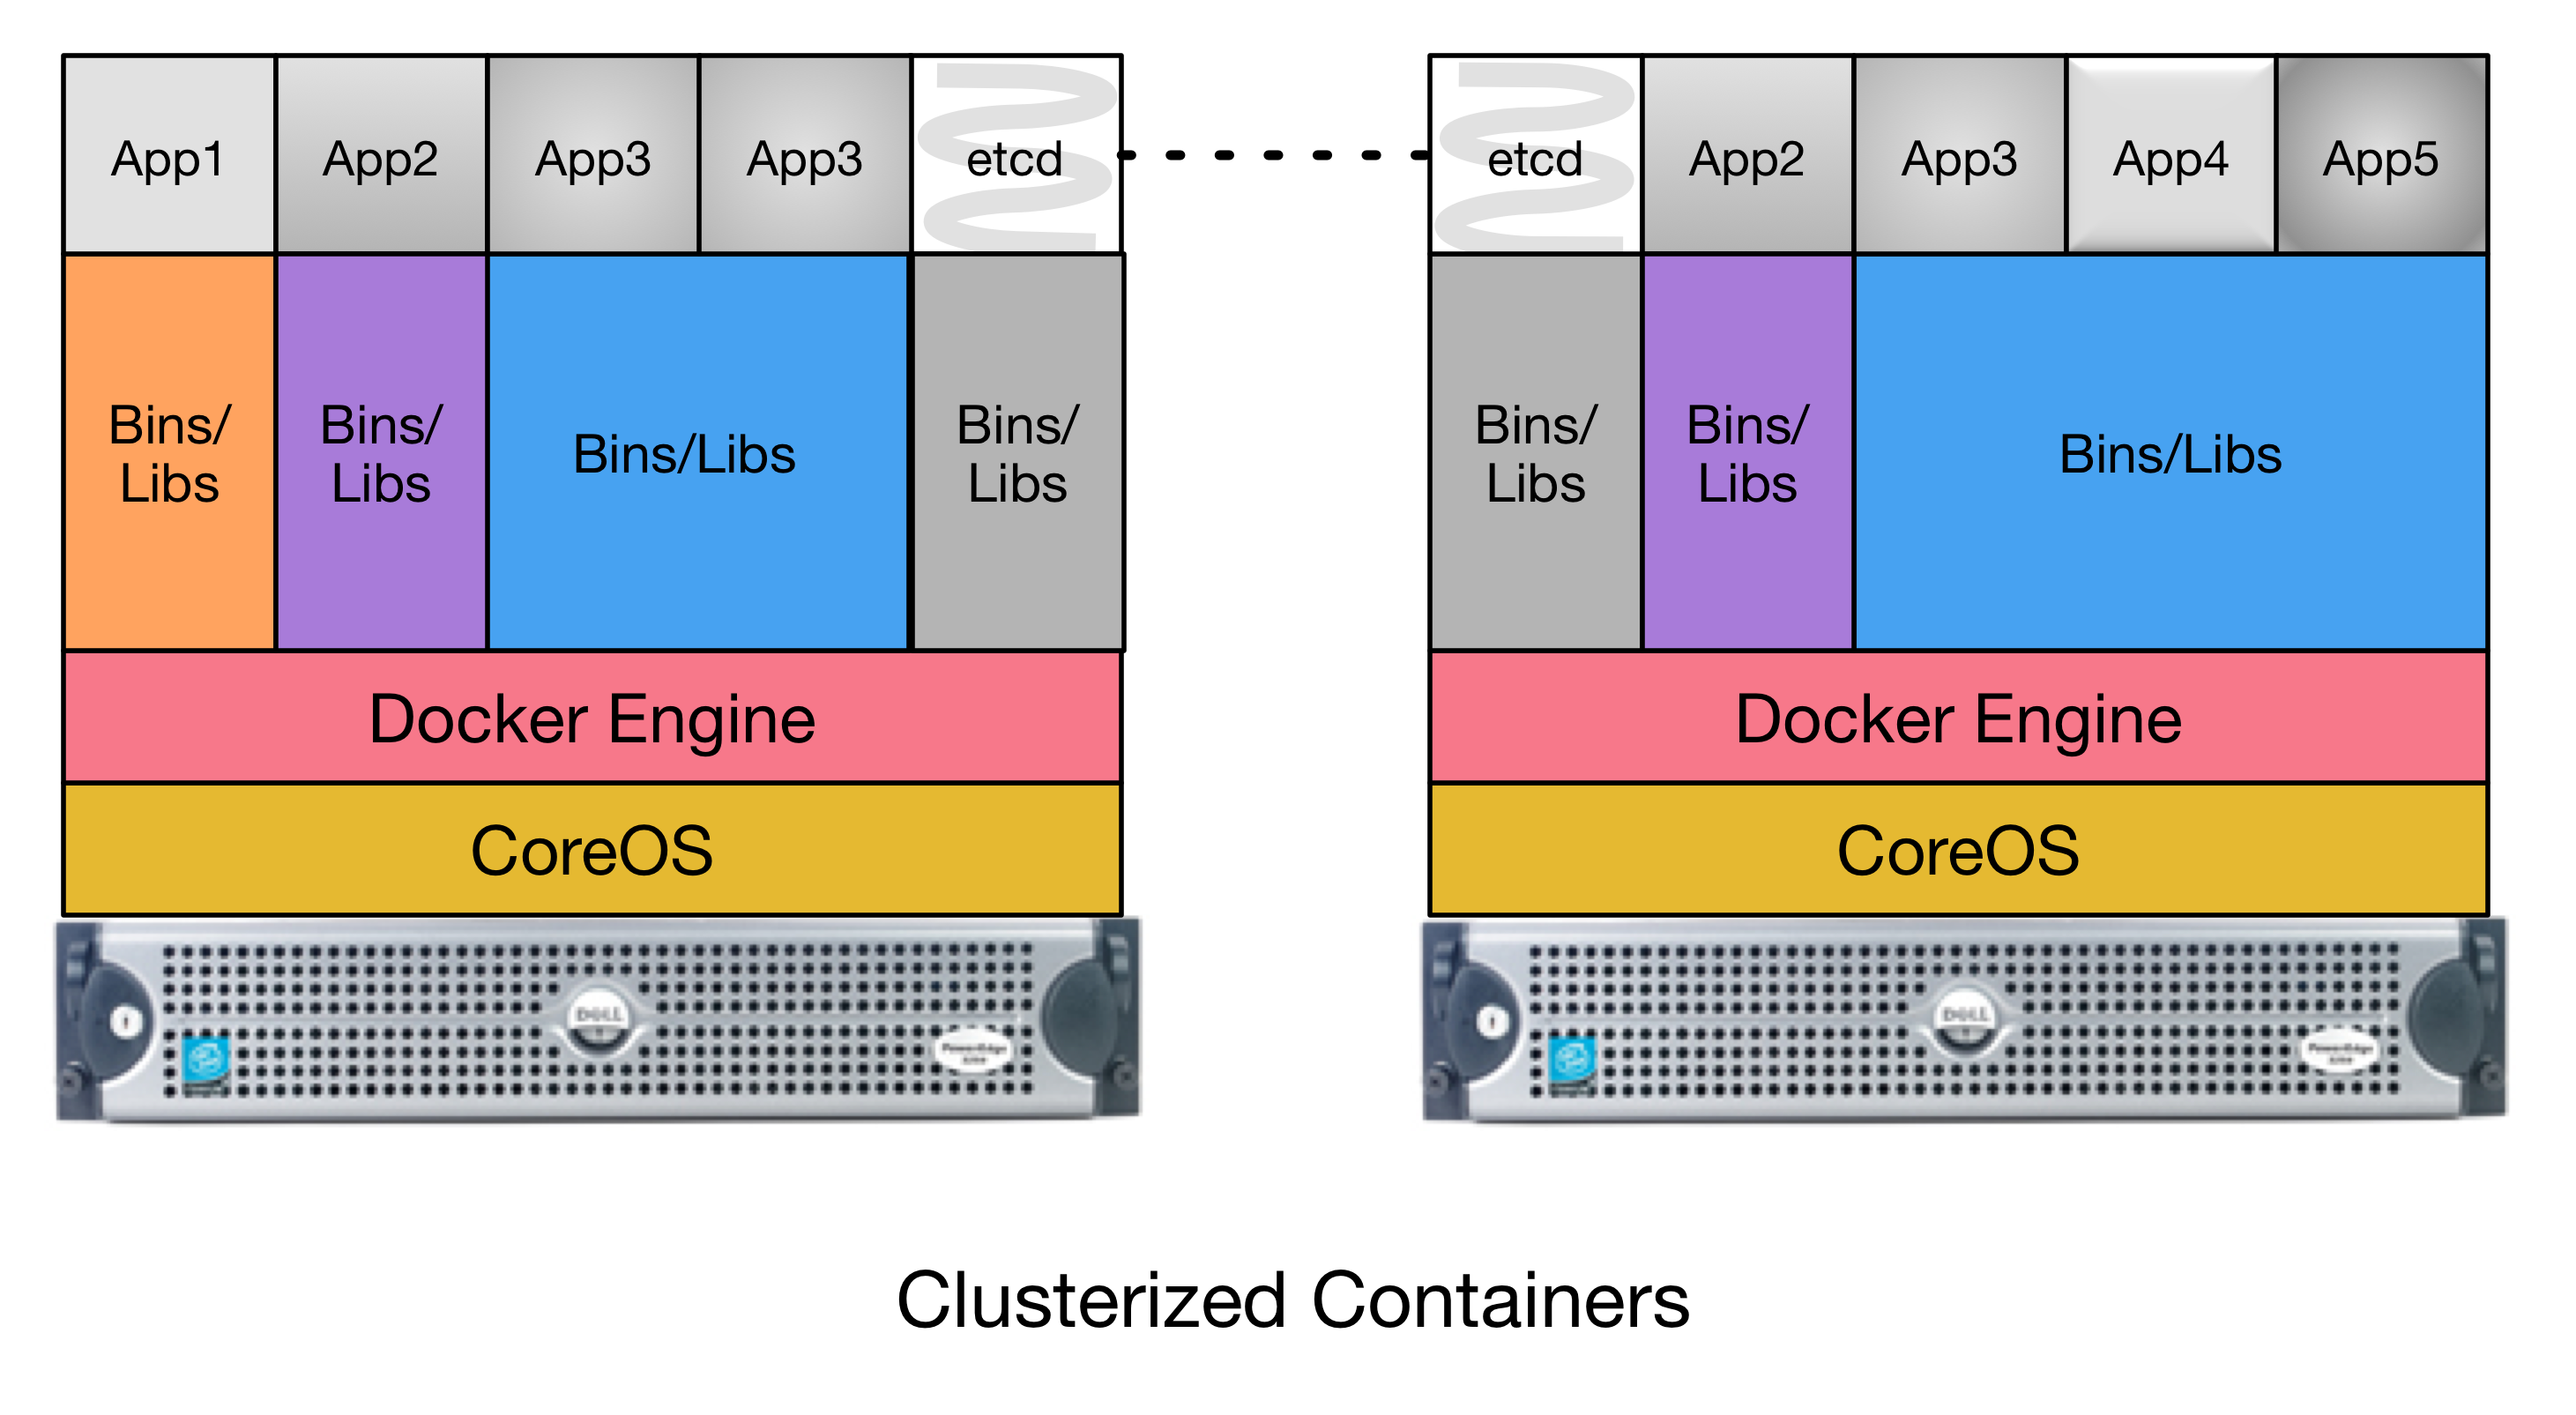
Clusterized Container Architecture
The final architectual model is combination of the earlier models. Figure Hybrid VM+Container Architecture depicts a Hybrid combination of bare metal, virtual machines, and containers within virtual machines. (Because containers are so light-weight, you can run containers in both the Host and Guests, containers within containers, or combinations nested within each other!)
The hybrid model can be accomplished by adding virtualized CoreOS nodes in the form of VM Guests along side other VM Guests in one server (as shown in Figure Hybrid VM+Container Architecture), or splitting pure virtual machines and pure-containerization across multiple servers (as shown in Figure Multi-server Hybrid Architecture).
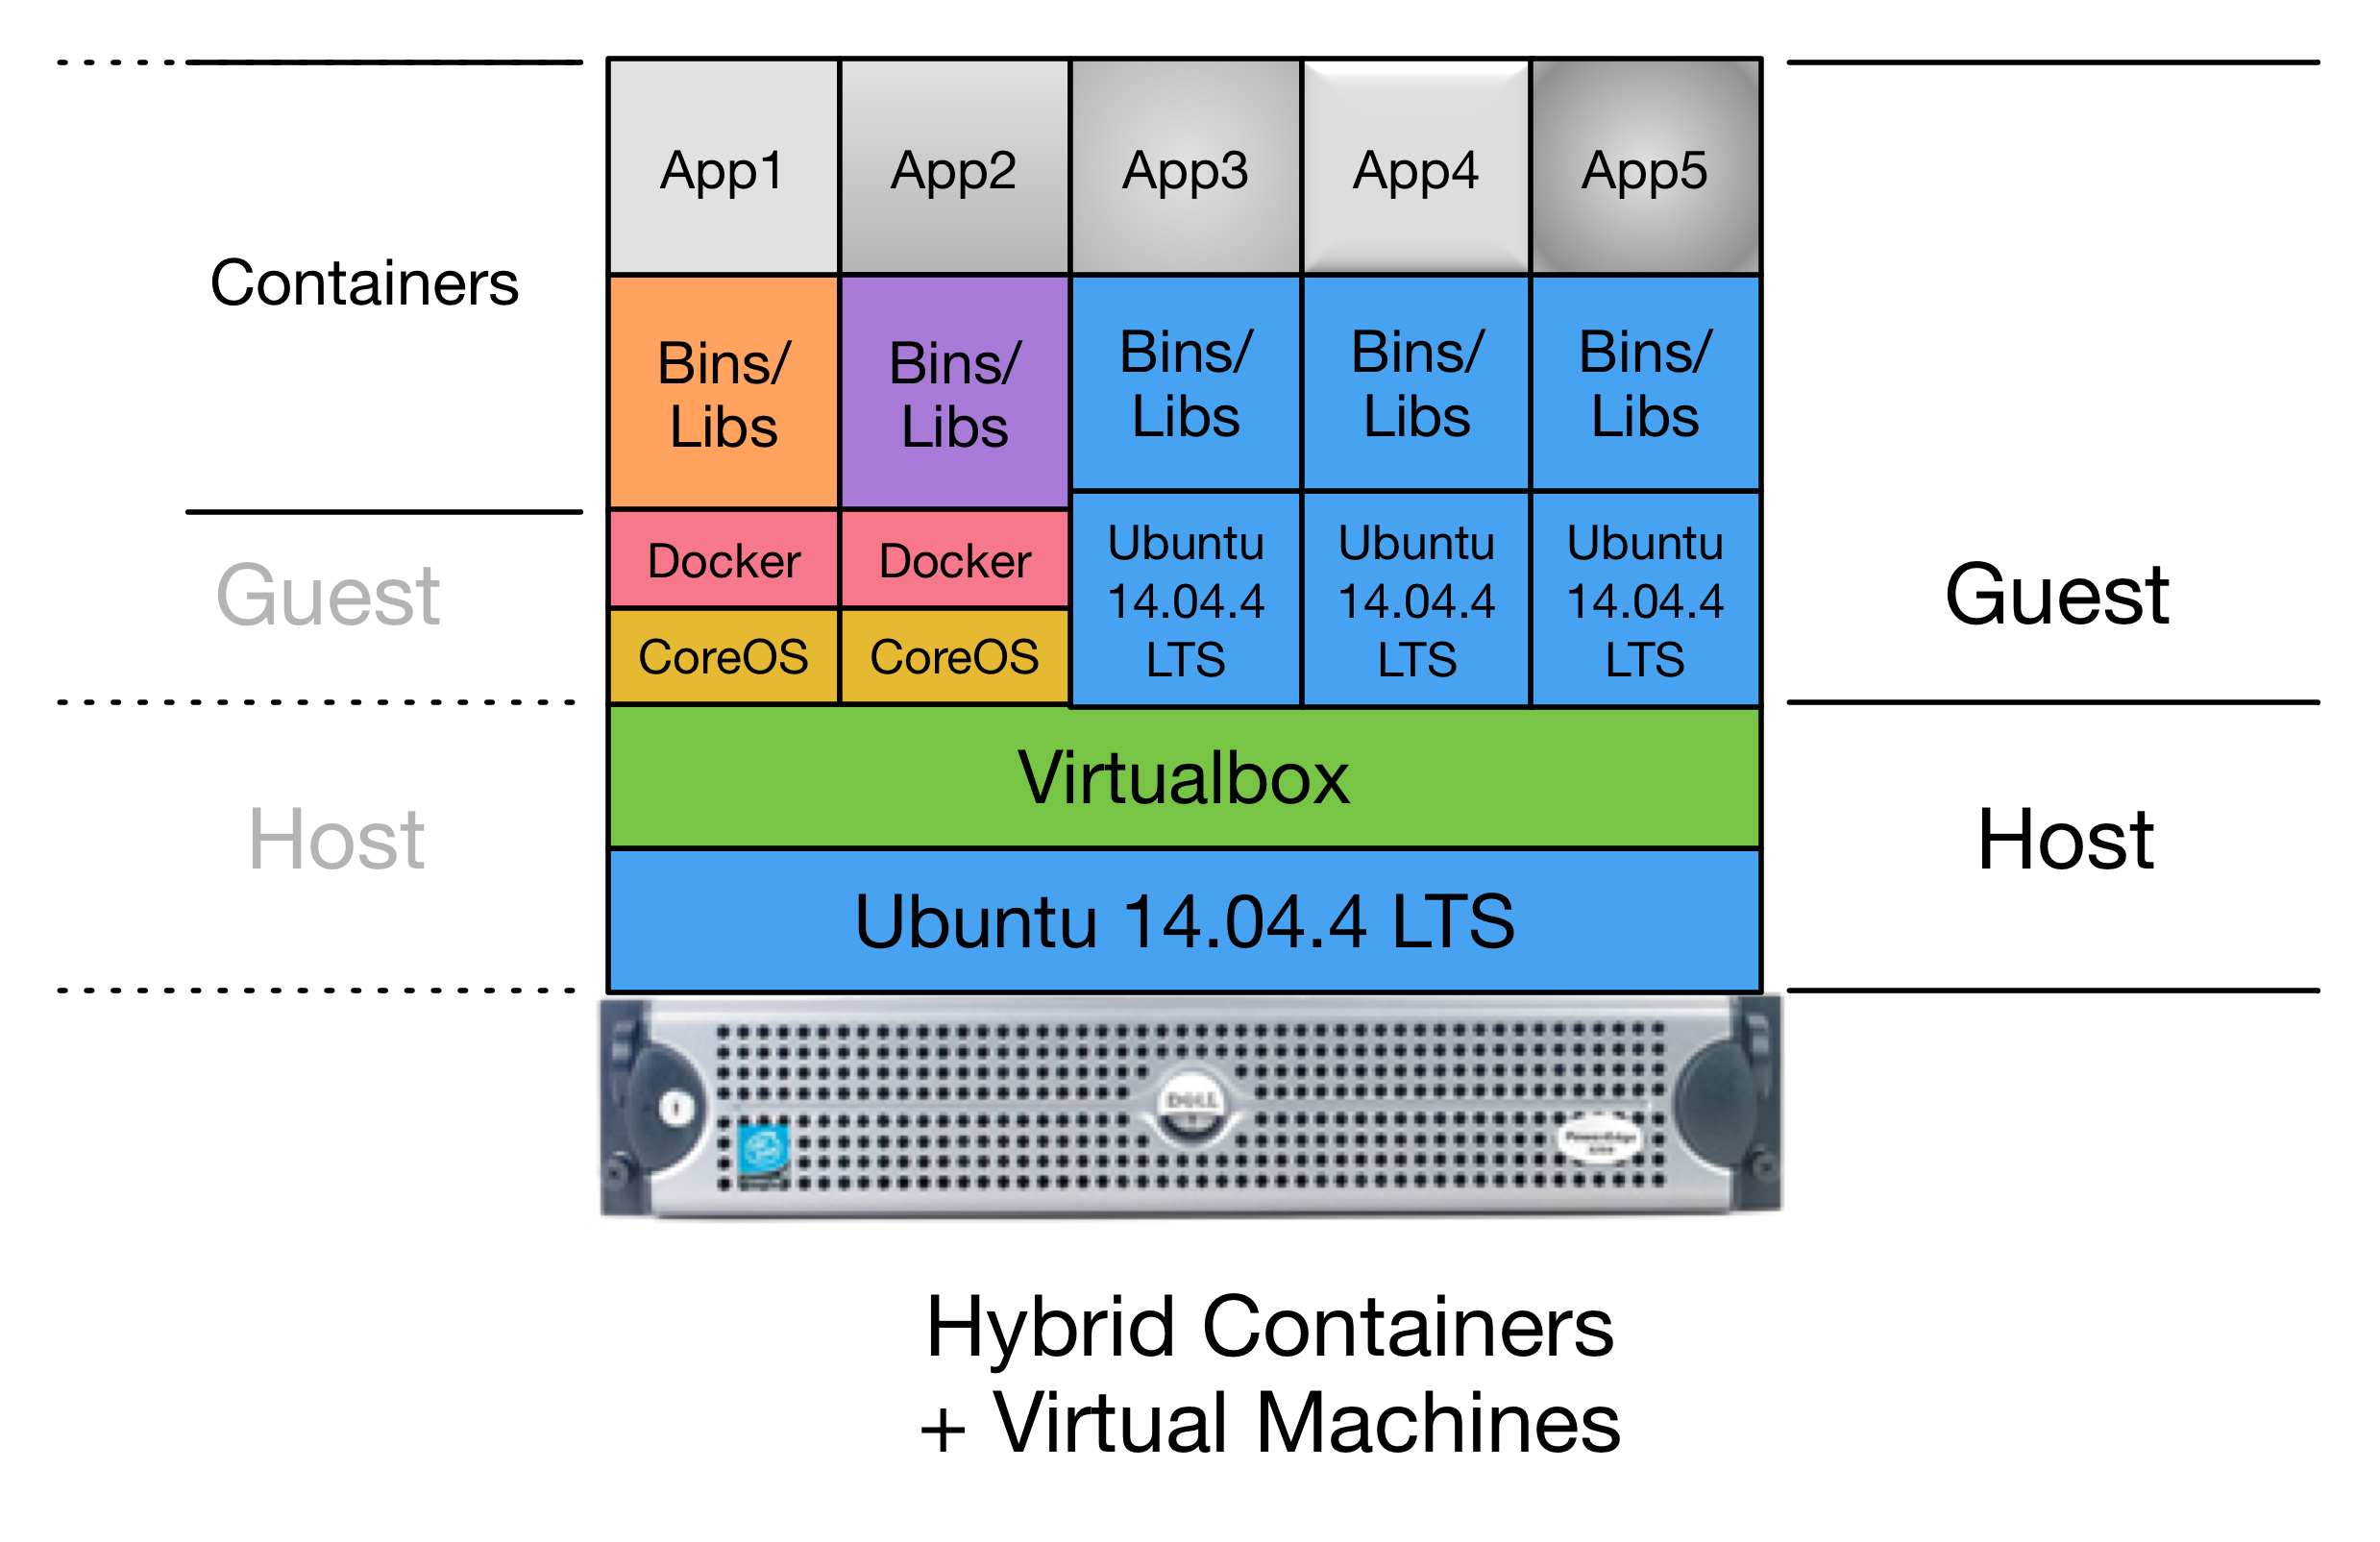
Hybrid VM+Container Architecture
Multi-server Hybrid Architecture
A primary advantage of this architectual model is the ability to use the separation of virtual machine Guests to leverage operating systems like CoreOS (that are designed for clusterized containerization support) along side multiple different base operating systems in other virtual machine Guests, within a single hardware server. This allows movement of services as necessary to address performance issues that may be discovered over time as the system scales up.
Note
The architecture currently being used for DIMS development uses the Hybrid model, with a three-node CoreOS cluster on bare-metal servers, with a fourth server supporting virtual machine Guests.
Work is underway to replicate the entire system using a single-server Hybrid deployment as shown in Figure Hybrid VM+Container Architecture as the prototype for the U.S. Secret Service ECTF deployment.
The ECTF deployment is being planned to be done with two servers with a subset of DIMS components (primarily focusing on the Trident portal.) One server will be used to provide a stable “production” service platform, while the second server can be used for staging new releases, testing, supporting migration to other data center facilities, or as a fallback in case the first system is damaged.
4.2. Internal Communications Architecture
The DIMS system was designed to overlay on top of the legacy PRISEM system and other open source security tools. PRISEM had interfaces to some of its services that integrated an instance of the Collective Intelligence Framework (CIF) database for IP-based reputation watchlists and historic attacker context, an archive of historic event logs, and remotely stored network flow data in SiLK format. The logical architecture that integrated these systems is a combination of message bus (using AMQP), SSH tunneled file and/or command line access, or HTTPS web interfaces and RESTful API.
Figure AMQP Messaging Bus Architecture shows the general flow of commands and logged events from clients and services used in the PRISEM system for inter-process communication between system components. In this example, there are three general RPC services named A, B, and C. Calls from remote clients A (color blue) and B (color black) are processed by one of n instances of multiprocessing service daemons on the same hardware as the AMQP broker (by multiple processes or virtual machines). Client C in this diagram (color green) is also a remote client, as is the RPC service C. (The AMQP broker and RPC mechanism allows these programs to run anywhere we want.) Also depicted in this diagram is an event feedback loop (color red). All clients and services log significant events such as process startup, process end, time taken to process RPC calls, or even more fine-grained debugging output to assist developers. These events logs are published to a fanout exchange, which distributes the events to any subscribers who wish to consume them.
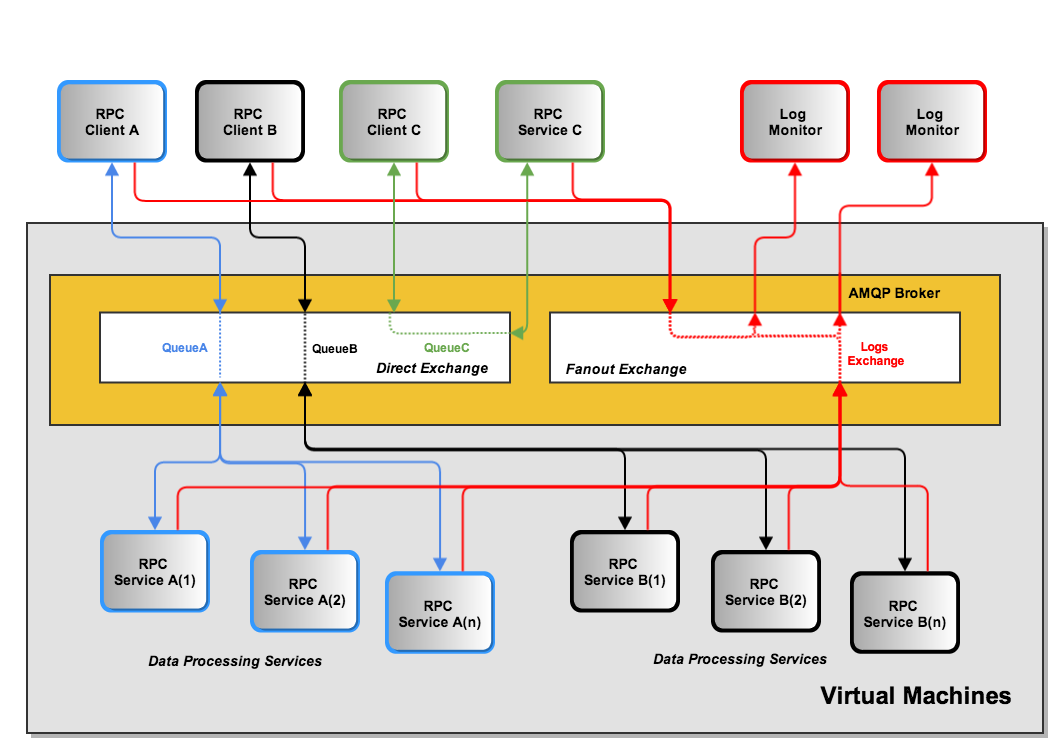
AMQP Messaging Bus Architecture
Figure Remote access via OpenVPN to VLAN1 depicts a high-level view of remote access from developer laptops (on the right) or servers at a remote site (on the left) using an OpenVPN tunnel that is routed via Network Address Translation to a non-public VLAN. This simplistic diagram does not show specific routable IP addresses of the remote systems, though it does show the tunnel IP address assigned by OpenVPN in relation to the OpenVPN server, and the difference between the network address ranges used by hosts on VLAN1 vs. the OpenVPN tunnel.
Note
In reality, there are multiple non-private network address ranges and VLANs in use by Virtual Machine hypervisors, Docker containers, and physical switch VLANs. This is described in the “DIMS As-Built” document and we are in the process of simplifying the highly-complicated networking implementation that resulted from building on top of the legacy PRISEM platform that goes back to the project’s initiation in 2008.
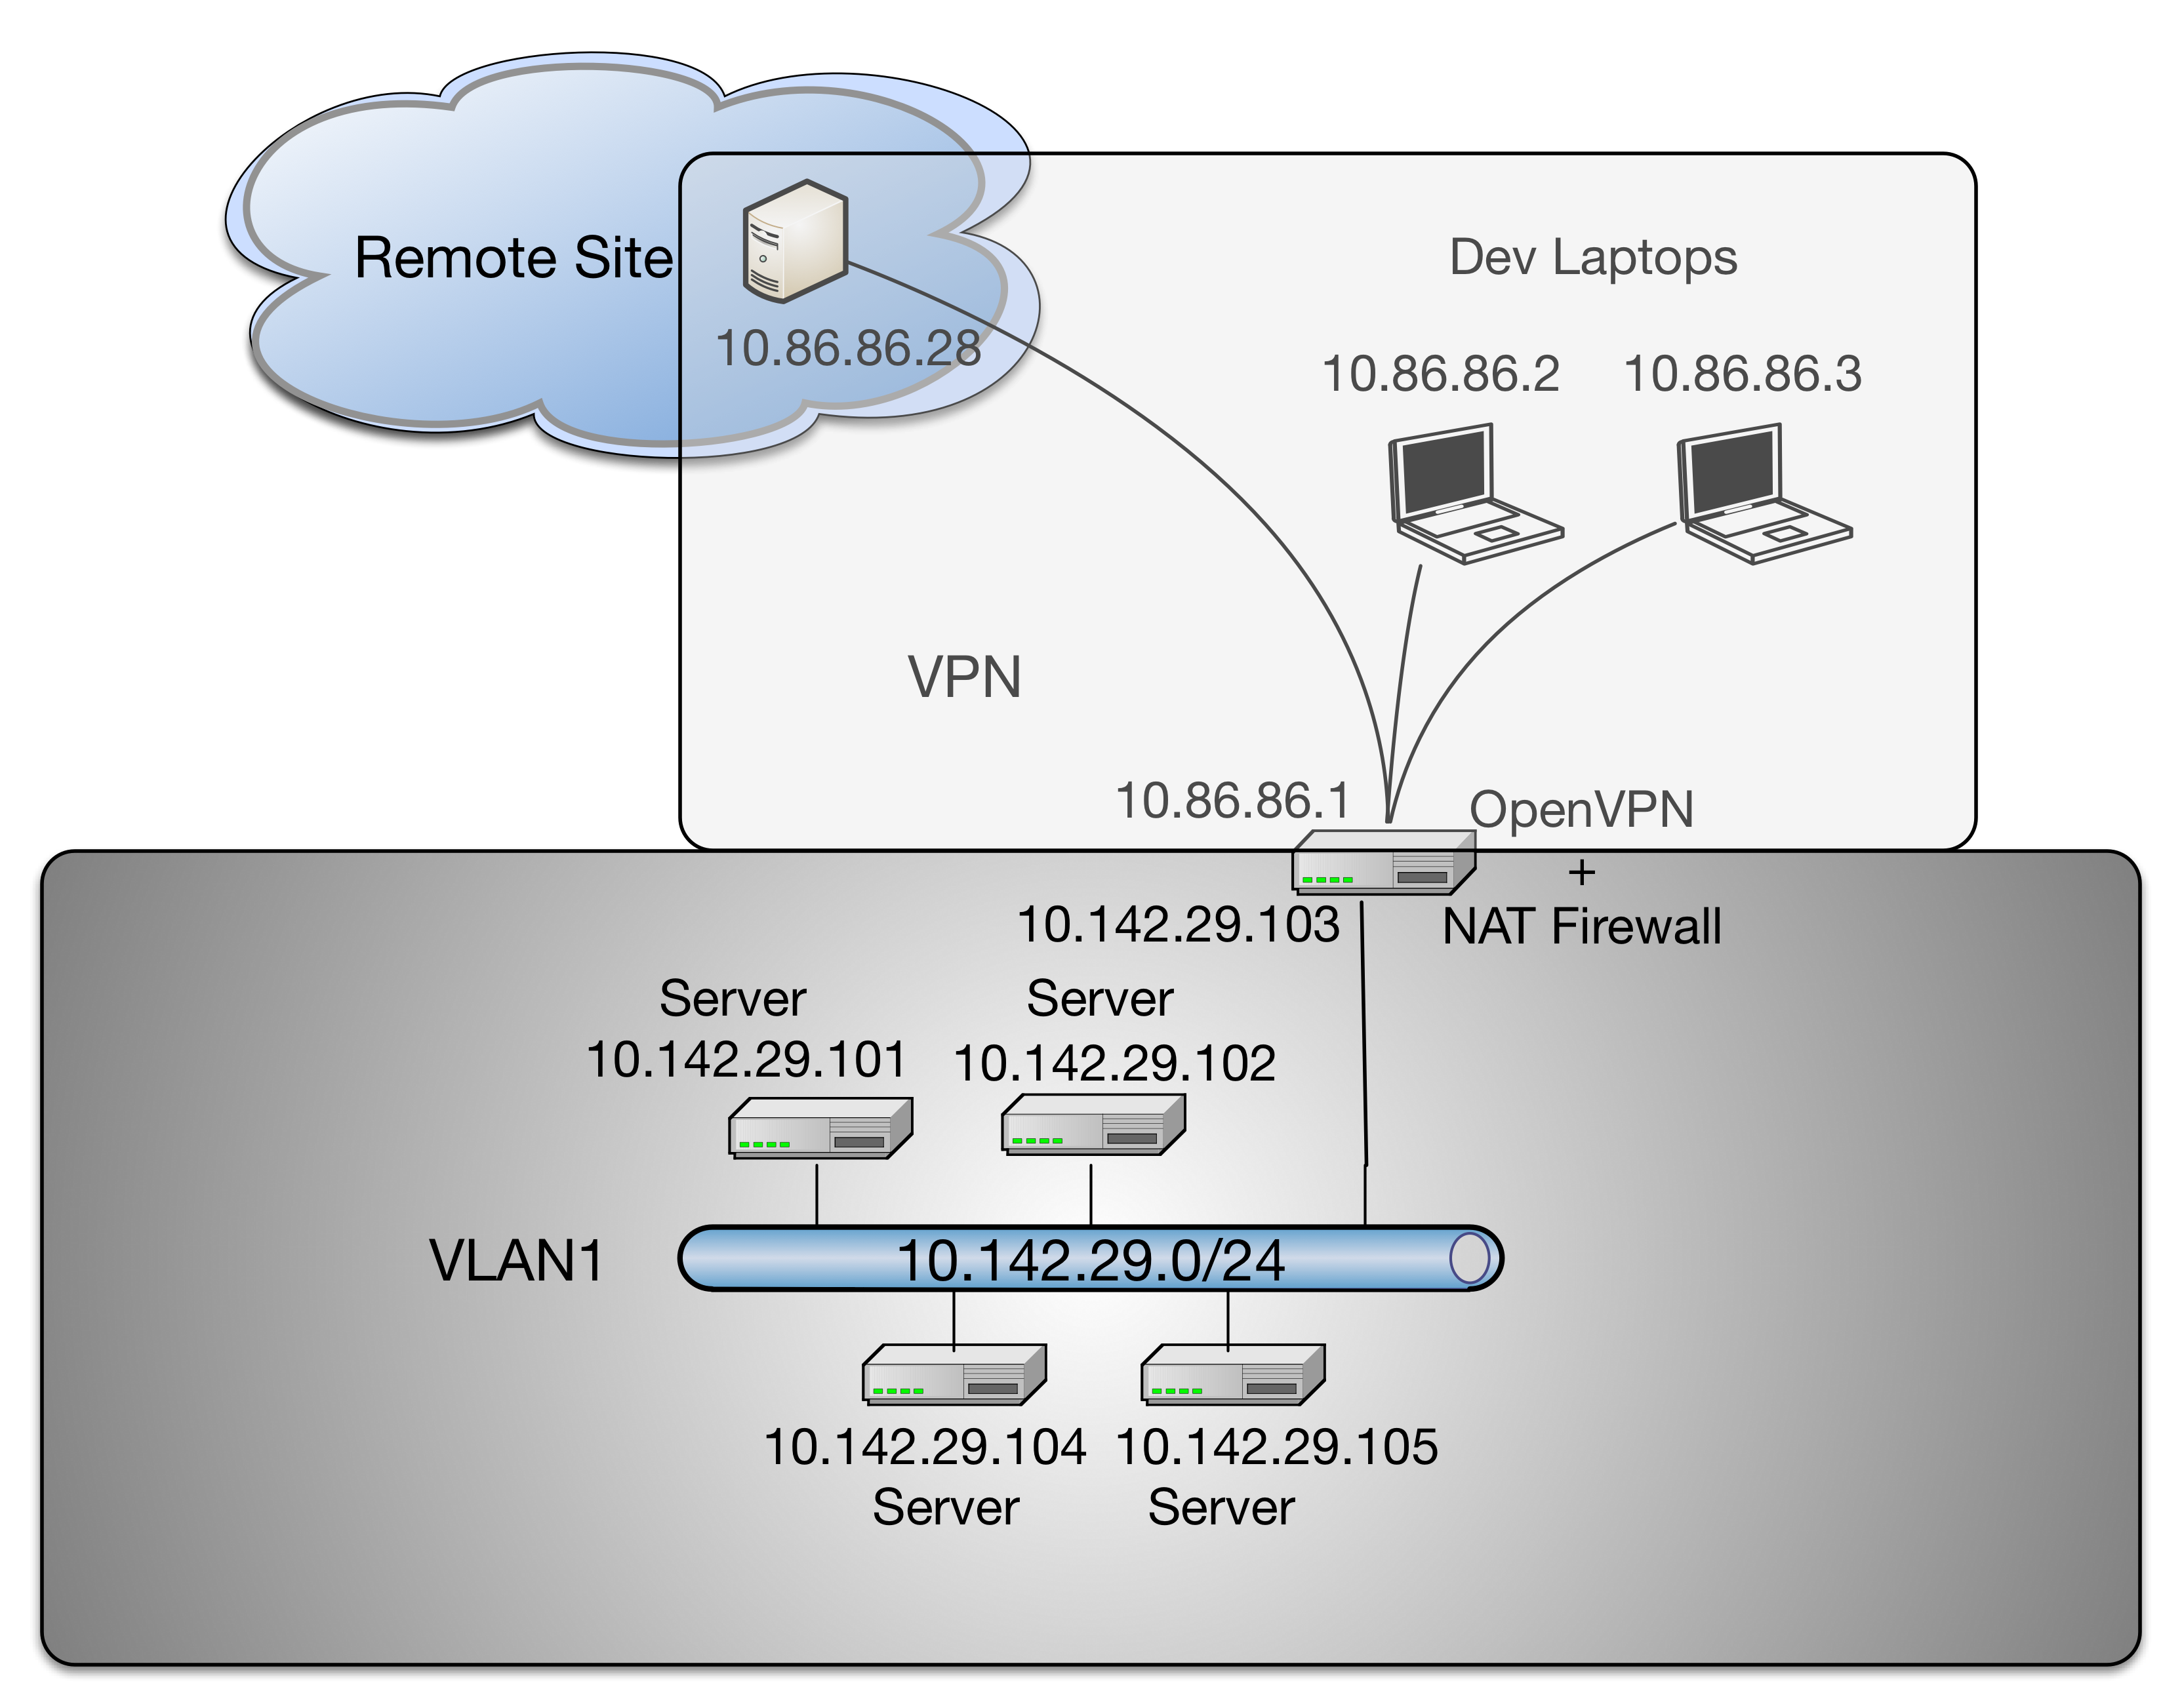
Remote access via OpenVPN to VLAN1
4.3. Concept of execution
The problem of event collection, correlation, and alerting, is quite common. Nearly every anti-virus vendor, managed security service provider, major internet platform provider, or multi-national enterprise, shares similar problems with processing event data. They are nearly all looking at the same type of architecture to handle the high data volumes and flow rates associated with large, high-bandwidth networks.
A common combination of open source tools used to process and index large volumes of event logs is Elasticsearch, Logstash, and Kibana, known as the “ELK stack” for short. The developers of the ELK stack refer to it [2] as “an end-to-end stack that delivers actionable insights in real-time from almost any type of structured and unstructured data source.” Elasticsearch provides flexible storage of data and flexible search of data. Logstash is used to parse the data, and then it sends it to Elasticsearch. Kibana then takes the parsed data from Elasticsearch and presents it through a browser in an easy-to-view way. Kibana’s dashboards are customizable in a variety of ways to we can better dissect and view the data.
- Elasticsearch
- Architecture behind our new Search and Explore experience (where “our” is Soundcloud... see “final box-diagram”)
- How HipChat Stores And Indexes Billions Of Messages Using ElasticSearch And Redis
- Using elasticsearch and logstash to serve billions of searchable events for customers
- Example configuration of Elasticsearch for AOL’s Moloch network flow monitoring tool
- How to use Elasticsearch with Python
- Security Analysts Discuss SIEM’S – Elasticsearch/Logstash/Kibana vs ARCSight, Splunk, and more
- Scaling an ELK stack at bol.com
- Logstash
- Kibana
The ELK stack has been used to process hundreds of millions to billions of events per day. Mozilla uses it as part of the Mozilla Defense Platform, or MozDef. (See Figure MozDef data flows for the data flow diagram for the Mozilla Defense Platform, or MozDef. See also Jeff Bryner’s Bsides PDX 2014 presenation on MozDef and Anthony Verez’ presenation MozDef: You’ve collected your security logs, now what? and accompanying slides.) The company Mailgun has described how they are Using elasticsearch and logstash to serve billions of searchable events for customers. (For an order of magnitude comparison, the PRISEM system currently collects between 30-60 million events per day, not the billions described in this reference.)
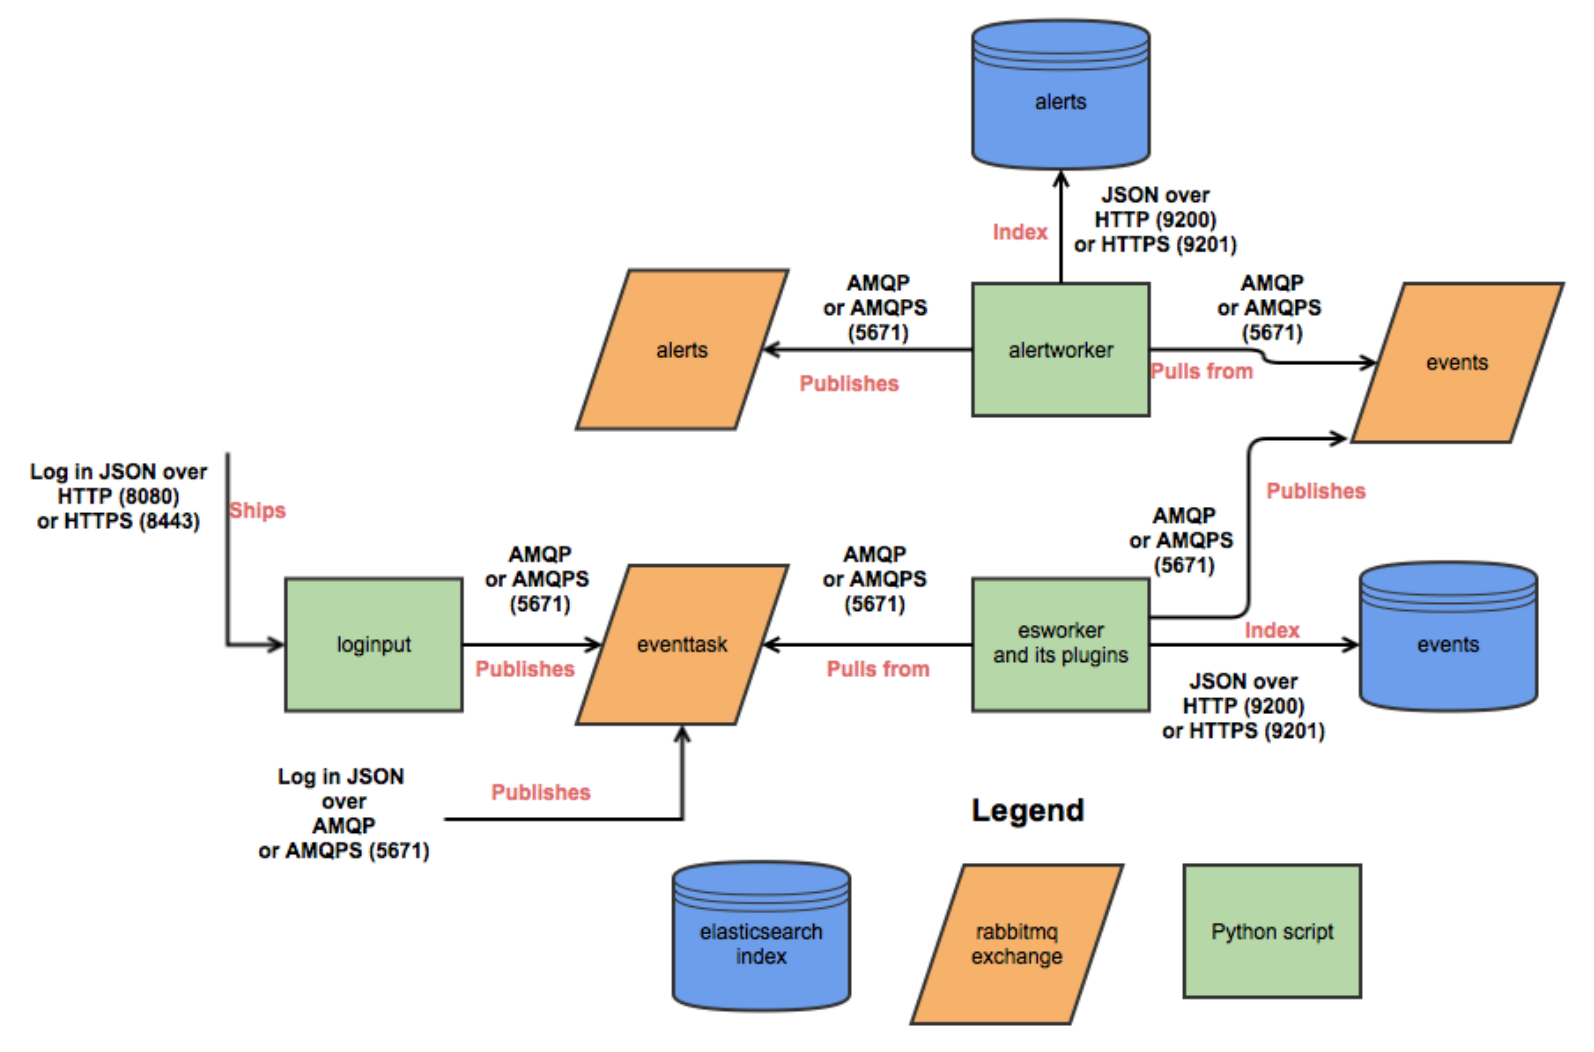
MozDef data flows
Figure Logstash and Metrics (source [1]) shows how the event log collection process works in terms of data flows between sources and ELK stack components. The DIMS system is designed to sit on top of such an event collection infrastructure.

Logstash and Metrics
Section Use of Containerization discusses Docker and its role in implementing a micro-service architecture. ELK stack components have been demonstrated being implemented in containers. (E.g., see Automating Docker Logging: ElasticSearch, Logstash, Kibana, and Logspout, by Nathan LeClaire and Scalable Docker Monitoring with Fluentd, Elasticsearch and Kibana 4, by manu, Elasticsearch, Weave and Docker, by errordeveloper, and the GitHub repository of iantruslove/docker-elasticsearch with a Docker image for ElasticSearch using Maestro orchestration.)
Real-time monitoring of Hadoop clusters describes deploying the ELK stack alongside Hadoop cluster nodes to provide a realtime monitoring capability. (See also Apache Hadoop 2.6.0 on Docker, by Janos Matyas, for containerizing the Hadoop cluster nodes.)
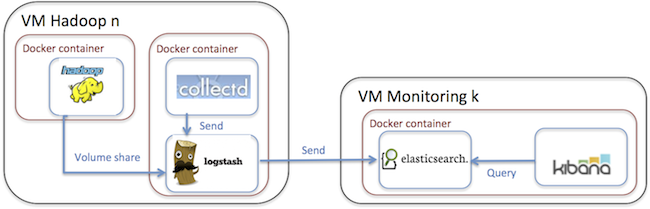
High-level architecture for monitoring Hadoop with the ELK stack
4.4. Interface design
4.5. File and Database Design
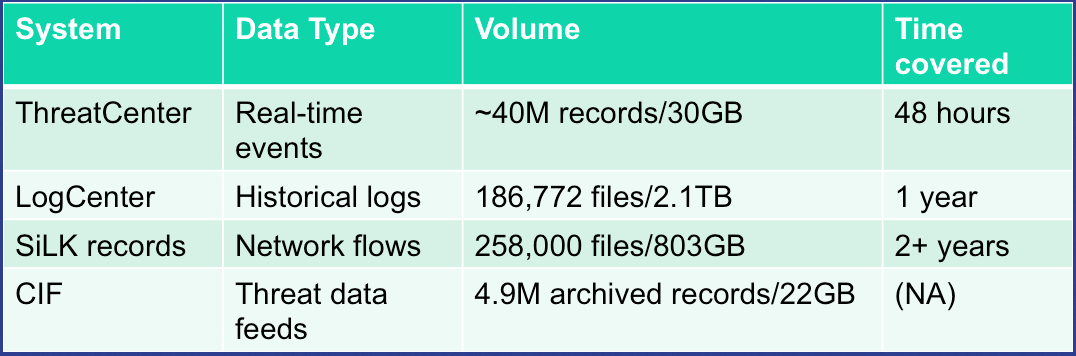
PRISEM Data Volumes
Figure PRISEM Data Volumes lists the database and non-database data sources used by the PRISEM system, along with the approximate timespan over which those records are kept.
4.6. Database Management System Files
There is an approximate average of 20M events per day collected by the ThreatCenter database server (zion.prisem.washington.edu), which is configured with a 48-hour data retention window. These records are kept in a database optimized for continuous correlation. The normalized records (which include the original raw event log) are stored in over 167,000 discrete read-optimized Vertica database files on the LogCenter server (money.prisem.washington.edu). The Collective Intelligence Framework database (v0.1) keeps its data in a Postgress database. This database is used to pull feeds from remote sites, and to generate feeds for use by the Botnets system’s watchlist detectors. At regular periods during the day, the CIF database has some tables copied into a read-optimized MySQL database known as Sphinx for accelerated discrete queries. (It is the Sphinx database that is used by the cifbulk RPC service).
4.7. Non-Database Management System Files
Network flow records are stored locally at the City of Seattle (pink.seattle.gov) in SiLK format. The disk capacity of 1TB is capable of holding just over 2 years of flow data in over 258,000 discrete SiLK data files. (SiLK is a highly-optimized fixed length binary format that is quite efficient for post-processing without needing a database management system.)
4.8. Human-Machine Interface
The raw inputs to PRISEM fall into three primary buckets: event logs from security devices in text form, which are normalized as they are processed by the SIEM; Network flow records that are received as NetFlow V5 records processed in real time and discarded, but a copy is converted to SiLK format and saved for historic query capability; reputation data pulled from various feeds and stored in a Collective Intelligence Framework (CIF) database. Various ad-hoc formats of “indicators of compromise” or “observables” are received from outside parties, which are primarily processed by hand (this includes indicators received from federal government sources, for example Joint Indicator Bulletins (JIBs) from the Federal Bureau of Investigation).
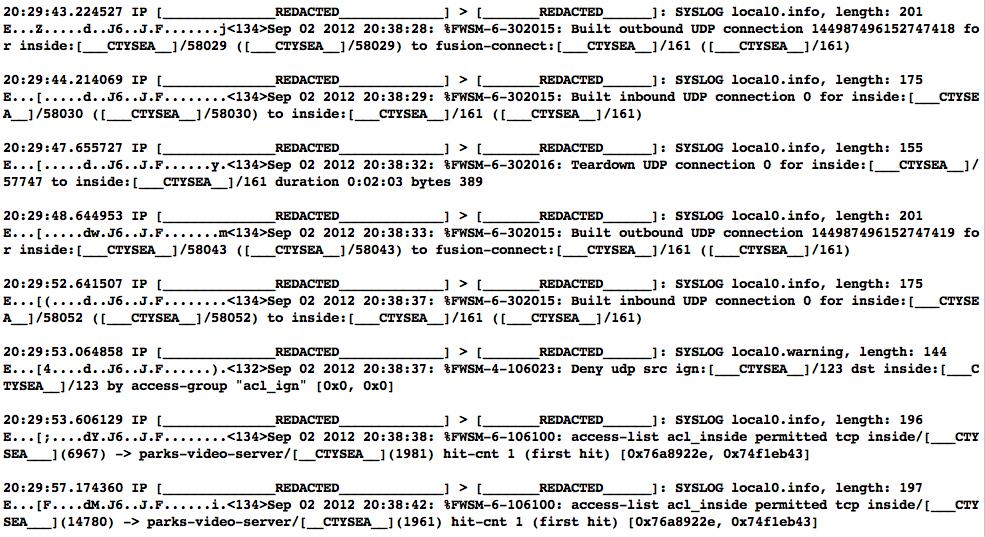
Cisco FWSM Event Log (Redacted)
Examples of standard security device logs can be seen in Figure Cisco FWSM Event Log (Redacted) (Cisco Firewall Security Manager, or FWSM), Figure Netscreen Event Log (Redacted) (Netscreen Firewall), Figure Tipping Point Logs (Redacted) (Tipping Point Intrusion Prevention System, or IPS), and Figure WebSense Log Sample (Redacted) (Websense web filter). These examples are redacted, but show representative content that is used for correlation (e.g., source and destination IP addresses, ports, protocols, etc.)
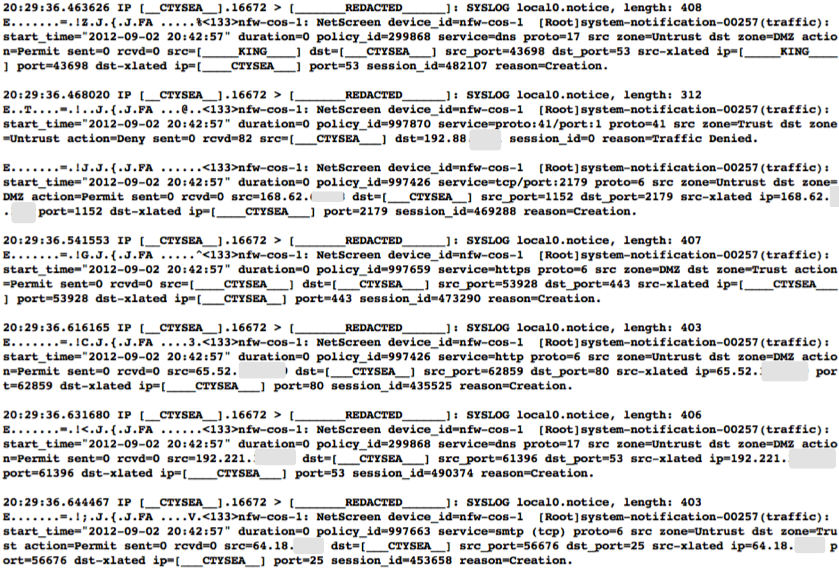
Netscreen Event Log (Redacted)
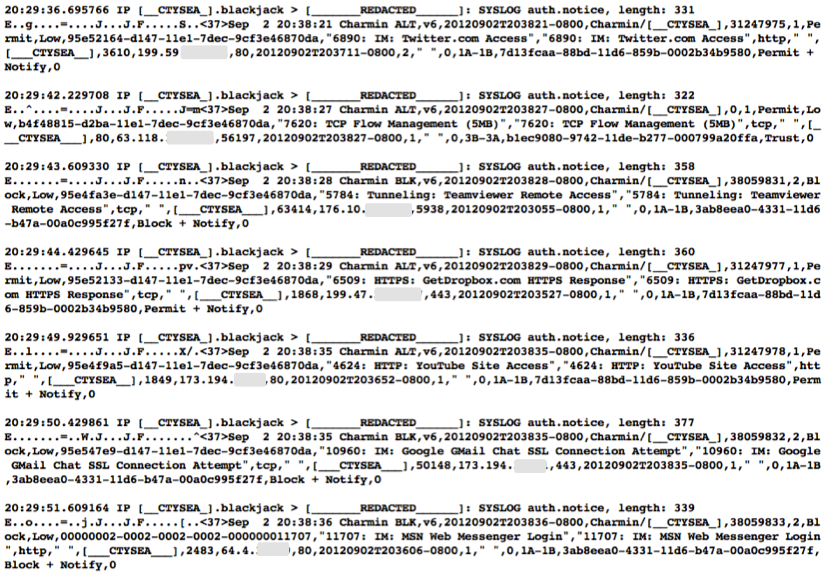
Tipping Point Logs (Redacted)
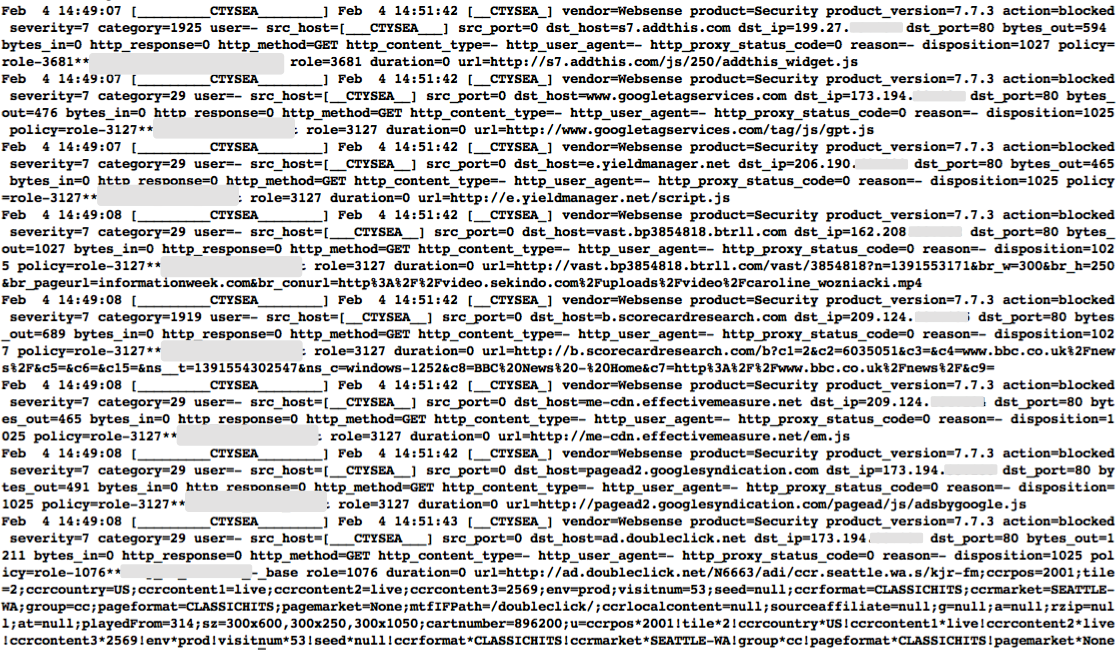
WebSense Log Sample (Redacted)
Figure Botnets System Event Log (Redacted) illustrates what events logged by the Botnets system detectors look like. All of these examples are for “watchlist” detectors that simply trigger when they see a connection to/from a host on the watchlist. Each detector has its own ID (e.g, “CIFList” in the first entry), followed by the ranking score for that detector (“@8” in this case for the CIFList detector). This is used in the calculation of score for ranking significance of events in the SIEM. Also shown are the IP addresses of the internal hosts involved in the alerted activity, as well as the IP addresses of the systems on the watchlists.
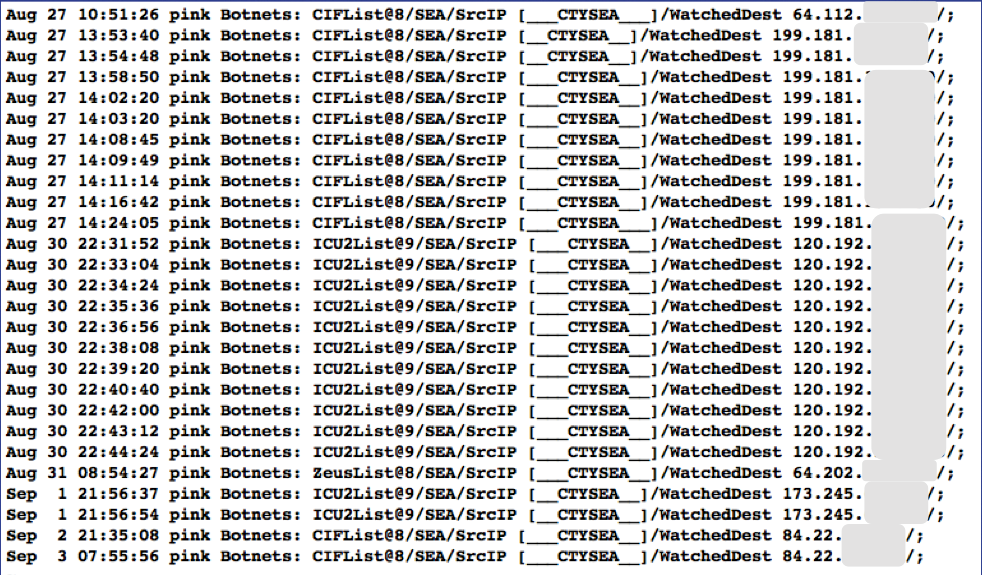
Botnets System Event Log (Redacted)
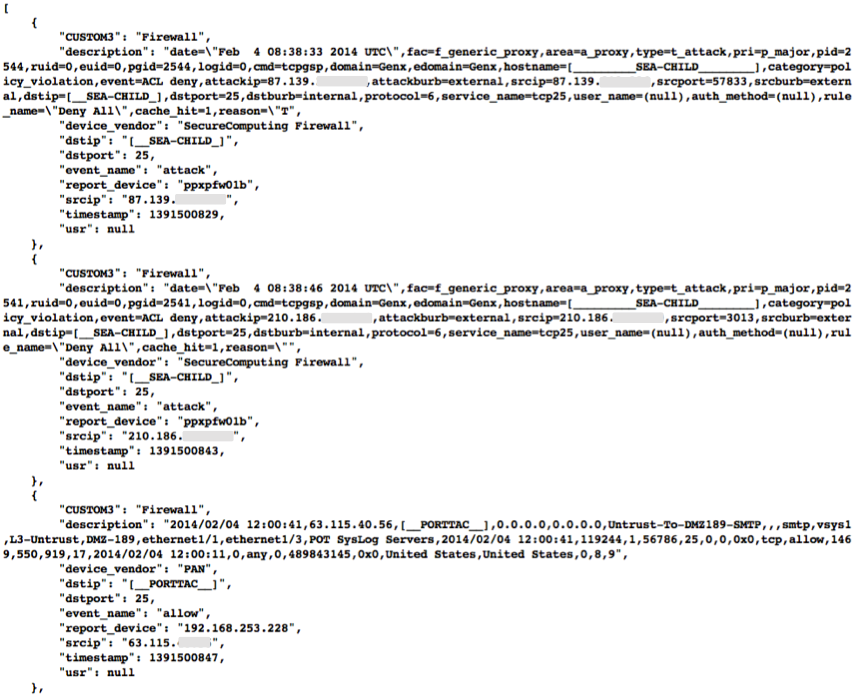
Example Historic Event Log Data (Redacted)
Figure Example Historic Event Log Data (Redacted) shows three records returned from a search of historic event logs from the Log Matrix SEIM log archive. These records have been anonymized to conceal the specific IP addresses and domain names of the sources (Seattle Children’s Hospital and the Port of Tacoma, in this case). Notice that the schema used by this vendor includes both destination IP address and destination port, but only includes source IP address (not source port) making certain queries of the database impossible. For example, attempting to find records related to malware that uses fixed source port for flooding could not be directly queried, requiring extraction of the “description” field (i.e., the original raw event) and parsing to identify related records. A solution to this would be to extract all of the data from the database and store it in a more flexible database.
Indirectly related to the previous data sources is meta-data that allows classification, filtering, and anonymization, based on organizational units for networks and sites. Table Participant identification mapping illustrates how top level domains and/or CIDR blocks for a subset of PRISEM participants are mapped to their Site ID strings and chosen anonymization strings (i.e., the label that participant would like to use to mask their internal IP addresses and host names in reports that are shared outside the trust group.) Their use in identification of “Friend or Foe” is described in the Concept of Operations document. (Such a cross-organizational correlation result using the full map as suggested in Table Participant identification mapping can be seen in Figure :ref`crosscorriff`.)
| CIDR or Domain | Site ID | Participant |
|---|---|---|
| 156.74.0.0/16 | CTYSEA | CTYSEA |
| .seattle.gov | CTYSEA | CTYSEA |
| .seattle.wa.gov | CTYSEA | CTYSEA |
| .seattle.wa.us | CTYSEA | CTYSEA |
| 192.103.189.0/24 | PORTTAC | PORTTAC |
| 66.113.101.0/24 | PORTTAC | PORTTAC |
| .portoftacoma.com | PORTTAC | PORTTAC |
| 174.127.160.0/24 | COB | BELLWA |
| 12.17.152.0/23 | COB | BELLWA |
| .bellevue.gov | COB | BELLWA |
| .ci.bellevue.wa.us | COB | BELLWA |
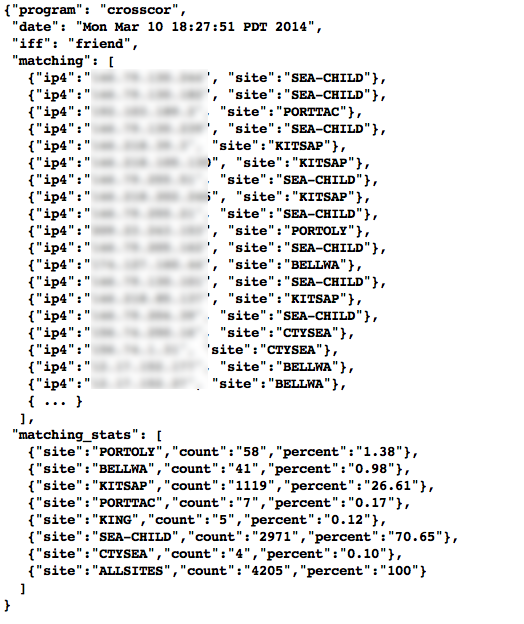
Cross-organizational Correlation of Query Results (Redacted)
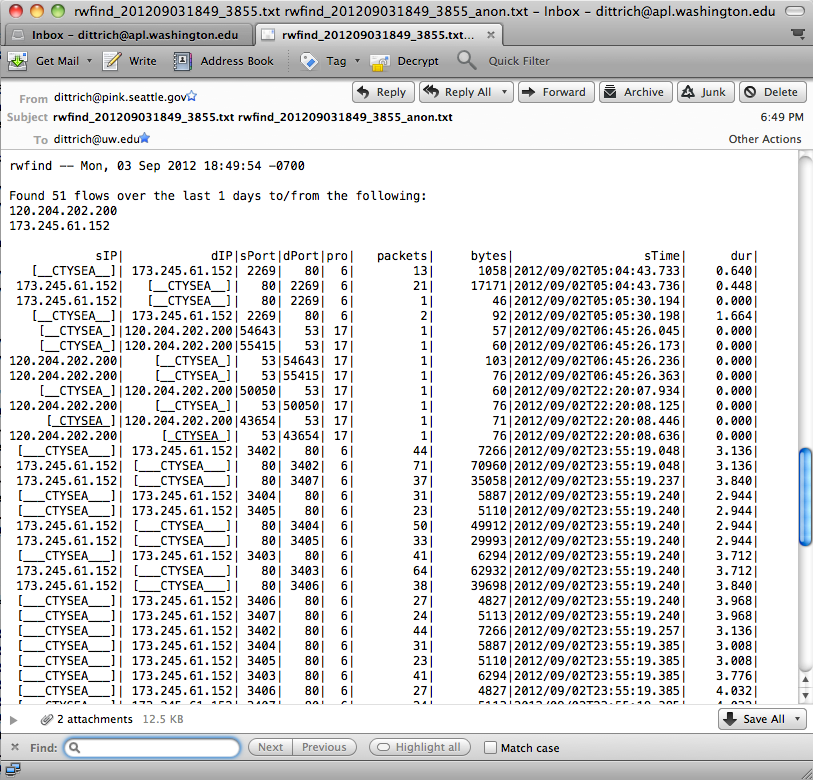
Example Network Flow Report (Anonymized Targets)
Footnotes
| [1] | http://www.semicomplete.com/presentations/logstash-hmmm |
| [2] | http://www.elasticsearch.org/overview |